Internet Usage Time
Problem
5-Question
members of your family or a group of five colleagues or friends (whoever they
are, you must survey five people) to discover how many hours per day they spend
on the internet each day across a one-week period. Display results in a table
or graph and be prepared to discuss your findings with others.
Solution:
PART 1 -My procedure for answering this question is as below.
I have designed a simple form to collect some data from my friends, Millar, Leanne, Peter, Millar's daughter - Channel, and Peter's son - Aiden, about their average internet usage time for a week. The following Table 1 displays my collected data on an average week.
Table 1-A collection of Internet Hours used by my friends and their children - on an average week.

From the collected data in Table 1 above, by putting these information into Microsoft Excel 2013 and using its functions of Insert / Chart / Insert Column Chart / 2-D line, my column graph and line graph have been automatically generated.
The next steps, I have used the Paint tool to capture and lightly tailor the images of the above graphs, then posted them on my subject learning webpage, my learning blogs, and the CSU's discussion forum.
For explanations, with the information collected, figures illustrating the average hours used by each member of my friend and their children, each day across a one-week period can be viewed in a column graph, also called the bar graph, as below. See Figure 1.

Figure 1 - The column graph, or the bar graph, of Internet Usage Time of my friends and their children.
OR The figures above can also be viewed in a line graph as below. See Figure 2

Figure 2 - The line graph of Internet Usage Time of my friends and their children.
OR
In terms of the total hours of Internet usage - on average - over the week, for a display of the relative amount or size of data as a whole, a pie graph is my option. See the Figure 3 below.
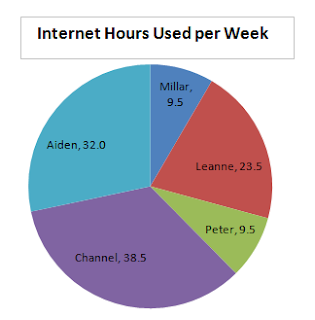
Figure
3 - The Pie graph of one-week Internet hours used by my friends and their children.
My notes:
*Note 1-Why is the internet usage time considered as a problem?
I believe that impacts of long hours using internet could cause problems for our physical health.
*Note 2-Internet usage time is various and varied. This depends on the difference of gender, ages, careers, habits of practice, contexts, and also some degrees of internet addiction.
PART 2-A COLLECTION of PEERS' FEEDBACK from the CSU' DISCUSSION FORUM


This task is also posted on
*my google site Learning Teaching Adult Numeracy in VET at https://sites.google.com/site/lydiale2016eeb308csu/display-the-results
*my google site Learning Teaching Adult Numeracy in VET at https://sites.google.com/site/lydiale2016eeb308csu/display-the-results
No comments:
Post a Comment